[ntt_percept page=”reading-list-email-newsletter”]
As long as we are willing to progress toward some designed solution, we can learn where the design has fallen short once it’s out and in the world. Then our job shifts to be adaptable and responsive.
Designing the best possible solution

Reading this I audibly gasped because I suddenly realized that’s why design systems work is so hard to describe—it’s a hyperobject!
Systems, Mistakes, and the Sea

Without the distraction of unnecessary detail, you are less likely to fall into the restrictive trap of thinking “but we have always done it this way”. Thinking in an abstract manner allows you to come up with new perspectives that are creative, and in many cases, better than the ones stemming from fixed ideas.
Functional fixedness: when we stick to what we know

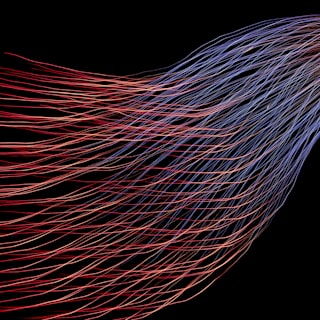
Data visualization is the translation of data into visual representations to communicate some significance. Raw data is encoded by position, shape, size, symbols, and color. This encoded graph is then decoded through the human visual system to gain understanding. Without this understanding, there are no benefits to the viewer.
How to design data visualizations that are actually valuable
Leave a Reply